The Gun Violence
“Epidemic”
Even proponents of gun rights frequently accept the fallacy that homicides
are on an upward spiral and that mass shootings are on the rise. Neither
perception is true, and accepting them at face value is not helpful to any
rational discussion of gun violence. While the numbers are incomplete
because some states do not fully report, the FBI’s Crime in the United
States (“CUIS”) database and analyses are the most reliable source of data
on homicides and other violent crimes.
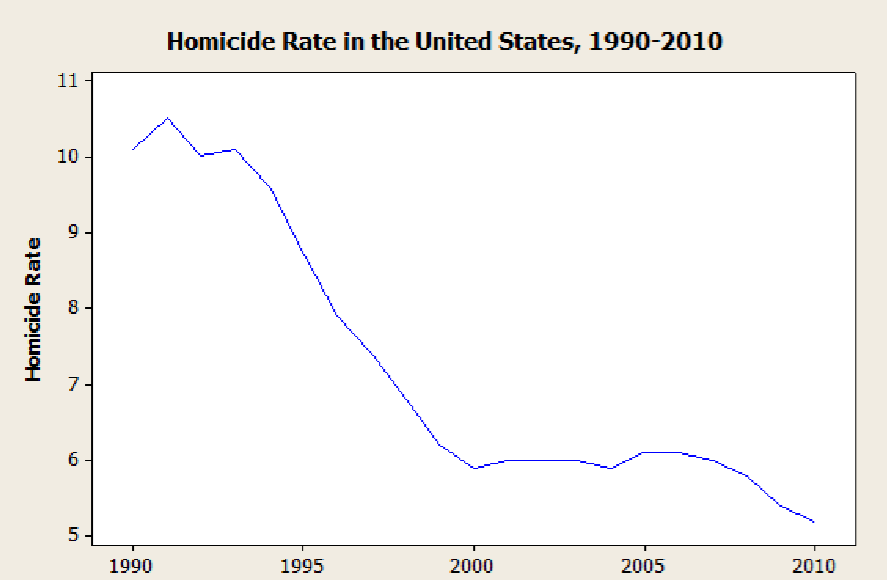
That data shows a consistent downward
trend in homicides between 1990 and 2014. Homicides peaked in 1980 and again
in the early 1990s at a rate of roughly 10 per 100,000 population but have
been declining since with only a moderate uptick in recent years. Between
1993 and 2014, homicides per 100,000 declined by approximately 0.2 per year.
During the same period, gun ownership in the United States soared. The graph
below shows the decline through 2010.
The CIUS data shows a similar pattern between 1960 and 2014:
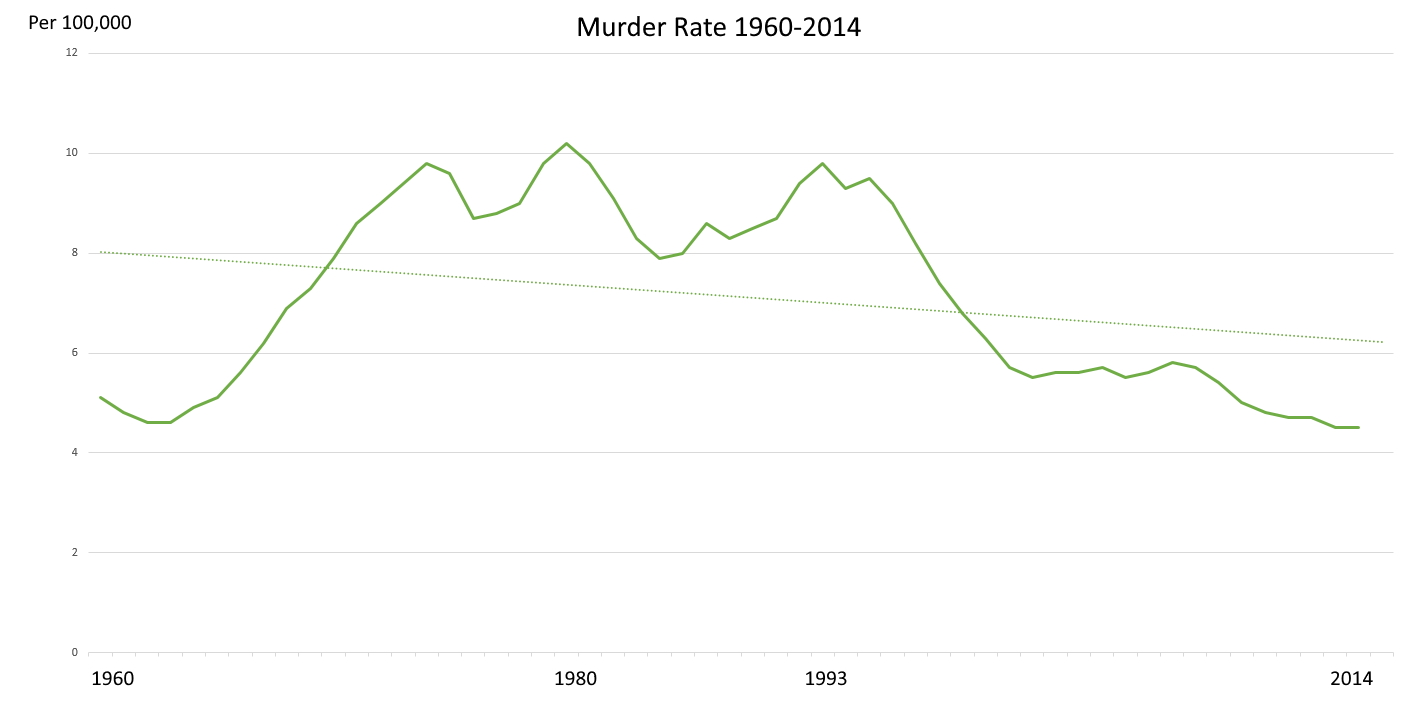
Source: https://ucr.fbi.gov/crime-in-the-u.s/2018/crime-in-the-u.s.-2018/topic-pages/tables/table-1
While the 2018 homicide rate
of 5.0 per 100,000 has increased slightly from the low of 4.4 per 100,000 in
2014, it is still only half of the 10 per 100,000 rate seen in 1980 and the
early 1990s.
When looking solely at homicides by firearm, the data shows a similar decline by nearly half between
1993 (7 per 100,000) and 2013 (3.6 per 100,000).
Despite the impression given by the media, the number of mass shooting
victims and events also has remained relatively consistent although the
number of fatalities in any given year can be widely skewed by one event
with a substantial number of victims.
In 2017,
Time Magazine compiled
the number of mass shooting deaths from 1982 to date and has continued to
update the compilation. That data from 2001 through 2018 appears below:
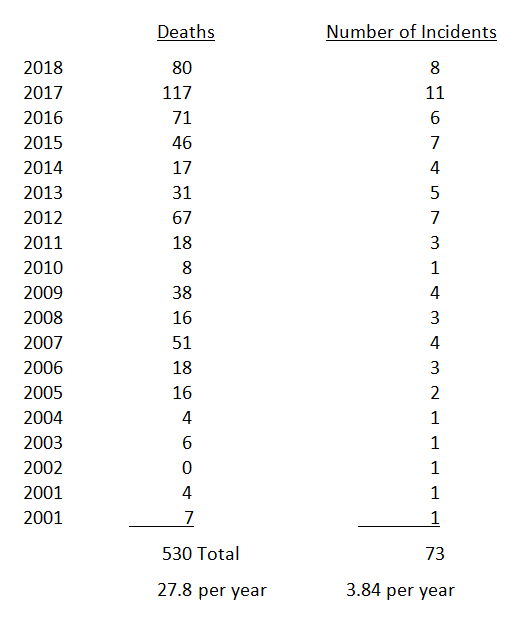
Source:
https://time.com/4965022/deadliest-mass-shooting-us-history/
Without minimizing the loss of life or societal cost, it should be noted
that years with higher fatality rates were almost always associated with one
or two particularly horrific events with a large number of casualties. For
example, there were 80 deaths in 2018, but the Parkland School shooting
accounted for 17 of those while another 13 were killed in the Thousand Oaks
bar shooting and 11 were killed in the Tree of Life Synagogue shooting.
Roughly half (58) of the 117 deaths in 2017 were from just one incident -
the Las Vegas Concert shooting. The Sutherland Springs shooting accounted
for another 26. In 2016, there were 71 fatalities, but the Pulse nightclub
shooting in Orlando accounted for 49 of those. There were only 46 fatalities
in 2015 and 14 of those (a third) were the San Bernardino shooting. At least
four of these shootings clearly were racially or ideologically motivated –
the Sutherland Springs, Orlando Nightclub, Tree of Life and San Bernardino
shootings. Others arguably were as well.
Lightning strikes kill about 100 people annually in the U.S. By contrast, it
is a rare year when mass shootings claim more than 100 fatalities and in
most years the number is not even close. On a per capita basis, your
calculator won’t show that many decimal places.
The bottom line is that you have a greater chance of being struck by
lightning than you do of being a mass shooting casualty.
Despite these irrefutable facts, the public perception is that homicides and
mass shootings are rising and indeed have reached epidemic proportions.
Opinion surveys regularly find that Americans believe crime is increasing.
Gallup surveys conducted between 1993 and 2018 found that at least
six-in-ten Americans believed there was more crime in the U.S. compared with
the year before, despite the actual downward trend in violent and property
crime rates throughout most of that period.
Pew Research Center surveys have found a similar pattern. A survey conducted
in late 2016 showed that 57% of registered voters believed that crime in the
U.S. had gotten worse since 2008, despite data showing that violent and
property crime rates declined by double-digits percentages during that
period.
The reason for this dichotomy almost certainly is agenda driven and
sensationalistic “reporting” of firearm related deaths – especially of mass
shootings which pose virtually no significant risk to the average person.
That perception is reinforced by others with a gun control agenda and even
by those who oppose further regulation who tacitly accept this perceived
reality as fact rather than correcting the misperception.
![]()
Relying primarily upon the FBI data, the Centers for Disease Control & Prevention ("CDC") reported 38,658 firearm related deaths in 2016 [REF LINK]. That is in a total U.S. population of 323,127,513 and therefore represents an incidence rate of .012%. Of these, only 11,004 or 28.5% were actually homicides. The remaining 71.5% was composed primarily of suicides (roughly 23,000 or 59.5%), with the remainder consisting of accidental discharge deaths, shootings by law enforcement, justifiable shootings in self-defense and deaths which could not clearly be categorized such as those where it could not be determined whether a death was accidental or a suicide.
Of the 11,004
homicides, a significant percentage were concentrated in three (3) major
cities which also happen to have some of the most strict gun control laws in
the nation.
687 of them (6.25%) were in Chicago;
275 of them (2.50%) were in Baltimore; and
![]()
In other words, 1,210 or 11% of the 11,004 homicides occurred in just three
(3) US cities, all of which have strict gun laws. That leaves 9,794
homicides for the entire remainder of the nation but even that is misleading
as some states have more than their share of gun homicides. California, for
example had 1,368 of the homicides in 2016; 12.4% of the total. And like Chicago, Baltimore and Detroit, California has very strict gun laws. If you subtract the
California gun homicides, you are left with just 8,426 to allocate among the
remaining 49 states; roughly 172 per state if you divide them equally.
Remember, however, that a substantial percentage of those remaining
homicides – at least 30% – involve
gang on gang or drug related violence between criminals, and are unlikely to
directly impact the average law abiding American. As a result, the
“epidemic” of gun related homicides is more like 70% of the remaining 8,426
or
a total of 5898 homicides
– at least if you do not live in California or one of the three cities
referenced above.
Excluding suicides from the total is not intended to diminish the
significance or tragedy of those events. Indeed, while firearms are used in
only a small minority of suicide attempts, their effectiveness means they
account for nearly half of all deaths by suicide. Because suicide can be an
impulsive decision, ready access to a firearm can be problematic. On the
other hand, people generally do not kill themselves with AR-15 rifles or
other “assault weapons” and homicides must be the primary focus in any
discussion of gun violence and regulation. While the number of accidental
shooting deaths per year is actually quite small (less than 500 in most
years per CDC data), many are preventable with good firearm handling
practices, making the grief they cause all the more senseless. Again,
however, regulatory efforts directed at the purchase and sale of firearms
would not alter the outcome. Every new firearm now sold in this country
comes with a trigger lock or similar safety device and owners must take
responsibility for the safe handling and securing of their firearms.
![]()
To put the 8,426 (or 11,004) gun homicide number in context, consider the
200,000 plus who die each year from preventable medical errors. Or the
35,000 plus per year that die in traffic accidents, over 3,000 of whom die
as a direct result of “distracted driving”; i.e. as a result of someone
driving while texting or otherwise not paying attention.
It has long been recognized that hospitals and doctor’s offices may be
hazardous to our health, but not just in the ways that we typically think.
Studies as early as 1999 recognized that medical errors caused or
contributed to as many as 98,000 preventable deaths each year. As better
data developed over the years, more recent publications estimate as many as
250,000 to 400,000 preventable deaths are caused by medical errors each and
every year. If medical error was a disease, it would be the third leading
cause of death in the U.S. just behind heart disease and cancer. Makary M.
A.,
Medical error—the third leading
cause of death in the US,
BMJ 353:i2139 (2016).
Accepting
only the lower end of the estimate, we are talking about a quarter of a
million preventable deaths – more than 22 times the total number of firearm
homicides per year.
A mere 10% decrease in those deaths would save more than DOUBLE the lives
lost to firearm homicides each year.
Yet there is no clamor for
increased oversight and regulation of the medical profession. In fact, the
reverse is true with repeated calls for tort reform to protect healthcare
providers from any effort to hold them
responsible and to limit the rights of those who have been victimized by
such errors.
Motor vehicles cause a similar number of deaths as firearms and over three
times the number of firearm related homicides. In 2015, there were a total
of 32,166 vehicular crashes in the United States resulting in 35,092 deaths.
Traffic Safety Facts Research Note,
U.S. Dept. of Transportation, National Highway Traffic Safety Administration
DOT HS 812 381 (March 2017) [REF
LINK].
Of those fatal accidents, 3,196 involved “distracted driving”, and in 442 of
them use of a cell phone was the reported distraction.
Id. In addition to those deaths, an estimated 30,000 injuries were
attributed to cell phone caused distractions in 2015.
Id. It also must be remembered that these figures represent only
hard data where cell phone use was proven or admitted by the driver. The
actual incidence rate undoubtedly was far higher and likely approached the
firearm homicide rate.
We could go on. A 2004 article in the Journal of the American Medical
Association evaluated various preventable causes of death in the U.S. for
the year 2000. The study found that tobacco was the leading cause of
preventable death, causing 435,000 or 18% of all preventable deaths that
year. Obesity and physical inactivity were not far behind at 400,000 or
16.6% of preventable deaths. Alcohol abuse was next with 85,000 or 3.5% of
preventable deaths. Firearm related deaths, including suicides, ranked far below
several other causes at 28,663 or 1.2% of preventable deaths.
Mokdad A.H., "Actual causes of death in the United States, 2000",
JAMA 291 (10):
1238–45 (March 2004)
[REF
LINK].
While all deaths are tragic, perspective matters and that is especially true
where legislative and regulatory policy and resources are concerned (See
this
LINK). When viewed in context with other causes of death, the
term “Epidemic” cannot fairly or rationally be applied to 8,426 deaths,
11004 deaths, or even 38,658 deaths resulting from the use/misuse of
firearms.
This article can be accessed and saved in PDF format by clicking HERE.
If you have something to say about this or any of the other subjects we
discuss, please click below to…
BACK to Just the Facts.
Author Note: Like many young men growing up in the rural South, the author owned a .22 caliber rifle and a shotgun, both of which were used for hunting and sport shooting. He no longer hunts and has passed the .22 rifle on to his son, but he still owns firearms for recreation and personal defense. He is not a member of the NRA and has no vested interest in the gun debate, but is tired of hearing heated arguments presented on both sides of the issue without bothering to learn the facts.